PDF 原檔:20260621_1303_南亞_JPM_Nan Ya Plastics Corp_original.pdf
原始內容
Quant
Factors
Value
Growth
Momentum
Quality
Low Vol
ESGQ
Current
%Rank
29
28
11
78
87
Hist %Rank (1=Top)
94
83
89
28
92
91
69
21
89
86
88
Nan Ya Plastics Corp 62 28 26 25
Blue skies turn to reality, raise PT to NT$200; good progress on M9/M10 CCL and T-glass; AI-grade might form >50% of mix by 2028
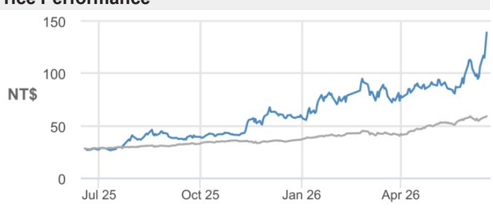
Nan Ya Plastics' share price has rallied by >40% over the past week (vs. Taiex: +8%) due to continued competitor price hikes across electronic materials, and rising expectations for potential good news from the company's M9/M10 qualification with Nvidia. We think the vast majority of investors remain skeptical and uninvested in Nan Ya Plastics, preferring more obvious pure-play PCB chain companies, which on average are up by 182% YTD (Tier 1/2: +221% YTD, see Fig 4). An M9/M10 order win in coming months might be the much-needed catalyst to trigger a valuation multiple re-rating, in our view. We raise 2026/27/28E EPS by 38-65% to reflect recent competitor price hikes and higher AI-grade product mix (JPMe M7+ now >60% of CCL revenue by 2028, and low-dk >50% of glass fiber revenue, versus negligible in 2025), and PT to a street high of NT$200/sh (4x P/B, ~30% 2028E ROE). Our PT implies 2026/27 P/Es of 23x/15x, offering a 5% 2027E dividend yield even at NT$200/share.
- Good progress on M8-M10 CCL and T-glass: As recently as 2025, NPC had less than 10% specialty grade electronic material exposure (mostly M4/M6 CCL and E-glass), with highly cyclical earnings. As such, even though NPC's 2025 CCL capacity was similar to Elite Material's, its CCL revenue and ASP was less than half of EMC's. We forecast NPC's gap versus industry leaders like EMC/Nittobo to narrow in coming years given the company's progress in next-gen electronic materials. NPC has won multiple M7/M8 orders over the past year and is ramping up production, and was one of 3 companies reportedly selected for M10 sampling with Nvidia. NPC was also successful in launching T-glass production and plans to triple capacity by 2028. Given the company is now operating at close to max utilization for most of its products and only has one major copper foil expansion starting in 1Q27, we view the next positive catalysts as: (1) successful M9-10 qualification, (2) expansion of high margin electronic material capacity, and (3) further upward earnings revisions on product mix improvement and price hikes.
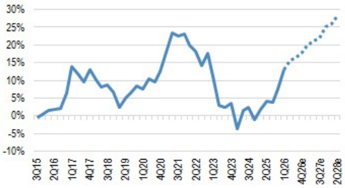
- Commodity-grade EM upcycle might last longer than you think: On 14 January, we highlighted our expectation for commodity-grade electronic materials to enter a bull market due to the 'server supercycle' coming from higher AI inference demand. NPC has a historical niche in general server EM, for which many customers are expected to migrate from M6 CCL to M7+ CCL in 2H26. We note that capacity upgrades typically come with a capacity conversion loss of 15-60% depending on product, exacerbating the shortage. While previous EM upcycles typically lasted 2 years, we do not rule out the potential for this cycle to be longer given significant capacity conversion loss against a backdrop of strong AI demand. We model NPC's electronic materials OPM peaking at a new record high of 28%, and note that even when the industry downcycle inevitably returns, we expect NPC's transition into M8-10 CCL, T-glass and HVLP 3+ copper foil to help keep margins above 10%.
- NER glass for M9 - broadening the opportunity for NPC . As noted by our analyst covering Nitto Boseki, Mio Shikanai, enquiries for NER-glass
Sources for: Style Exposure - J.P. Morgan Global Markets Strategy; all other tables are company data and J.P. Morgan estimates.
See page 10 for analyst certification and important disclosures, including non-US analyst disclosures.
Overweight
1303.TW, 1303 TT Price (18 Jun 26):NT$139.00
▲Price Target (Dec-27):NT$200.00
Prior (Jun-27):NT$125.00
Head of Asia Energy & Chemicals | Asia EV Battery
Parsley Ong AC
(65) 6882-8578
parsley.rh.ong@jpmorgan.com
J.P. Morgan Securities Singapore Private Limited/ J.P. Morgan Securities (Asia Pacific) Limited/ J.P.
Morgan Broking (Hong Kong) Limited
Michelle Wong
(852) 2800 8556
michelle.wong@jpmorgan.com
J.P. Morgan Securities (Asia Pacific) Limited/ J.P. Morgan Broking (Hong Kong) Limited
Vicky Hsia
(852) 2800 3752
vicky.hsia@jpmorgan.com
J.P. Morgan Securities (Asia Pacific) Limited/ J.P. Morgan Broking (Hong Kong) Limited
Key Changes (FYE Dec)
| Prev | Cur | Δ | |
|---|---|---|---|
| Adj. EPS - 26E (NT$) | 6.26 | 8.63 | 37.8% |
| Adj. EPS - 27E (NT$) | 8.13 | 13.41 | 64.9% |
Style Exposure
Flice Ferrormance
Ferrormance Drivers
150
Market
6%
Region
J.P. Morgan
100
NT$
Idiosyn.
0
Jul 25
Oct 25
Factors
Market: MSCI Asia Pac ex JP
Price Performance
Macro:
HSI Volatility Index
Quant Styles:
DivYld
Quality
LowVol
Jan 26
74%
1Y Corr
0.26
Apr 26
6M Corr
0.56
0.15
— TSE (rebased)
-0.04
| Company Data | |
|---|---|
| Shares O/S (mn) | 7,931 |
| 52-week range (NT$) | 139.00-26.25 |
| Market cap ($ mn) | 34,902 |
| Exchange rate | 31.58 |
| Free float (%) | 61.0% |
| 3M ADV (mn) | 82.29 |
| 3M ADV ($ mn) | 240.8 |
| Volatility (90 Day) | 80 |
| Index | TAIEX |
| BBG ANR (Buy | Hold | Sell) | 6|2|1 |
Key Metrics (FYE Dec)
| NT$ in millions | FY25A | FY26E | FY27E | FY28E |
|---|---|---|---|---|
| Financial Estimates | ||||
| Revenue | 259,912 | 304,503 | 376,983 | 419,829 |
| Adj. EBITDA | 26,221 | 52,255 | 81,056 | 101,240 |
| Adj. EBIT | 3,704 | 29,591 | 57,883 | 77,611 |
| Adj. net income | 4,519 | 68,454 | 106,347 | 120,294 |
| Adj. EPS | 0.57 | 8.63 | 13.41 | 15.17 |
| BBG EPS | 0.41 | 6.49 | 6.82 | 9.78 |
| Cashflow from operations | 8,649 | 72,768 | 108,667 | 132,034 |
| FCFF | (754) | 63,502 | 98,845 | 124,217 |
| Margins and Growth | ||||
| Revenue Growth Y/Y (%) | 0.1% | 17.2% | 23.8% | 11.4% |
| EBITDA margin | 10.1% | 17.2% | 21.5% | 24.1% |
| EBITDA Growth Y/Y (%) | 13.3% | 99.3% | 55.1% | 24.9% |
| EBIT margin | 1.4% | 9.7% | 15.4% | 18.5% |
| Net margin | 1.7% | 22.5% | 28.2% | 28.7% |
| Adj. EPS growth | 35.3% | 1414.9% | 55.4% | 13.1% |
| Ratios | ||||
| Adj. tax rate | 21.6% | 21.6% | 21.6% | 21.6% |
| Interest cover | 10.7 | 19.9 | 32.7 | 49.7 |
| Net debt/Equity | 0.3 | 0.2 | 0.2 | 0.1 |
| Net debt/EBITDA | 4.8 | 1.8 | 1.0 | 0.5 |
| ROCE | 0.6% | 4.5% | 8.7% | 11.3% |
| ROE | 1.3% | 18.7% | 27.2% | 28.9% |
| Valuation | ||||
| FCFF yield | (0.1%) | 5.8% | 9.0% | 11.3% |
| Dividend yield | 0.6% | 4.3% | 7.2% | 8.7% |
| EV/Revenue | 4.8 | 4.0 | 3.2 | 2.8 |
| EV/EBITDA | 47.5 | 23.2 | 14.8 | 11.6 |
| Adj. P/E | 244.0 | 16.1 | 10.4 | 9.2 |
0%
Summary Investment Thesis and Valuation
Investment Thesis
NPC is a major producer of electronic materials (CCL, Copper foil, Epoxy Resin, glass fiber, PCB), polyester, chemicals (mainly MEG/BPA), and PVC plastics. We are OW on NPC on the back of emerging EPS positives from a multi-year PCB material supply tightness and its transition towards specialty grade electronic materials. While we estimate that >90% of NPC's electronic materials sales are commodity-grade with lower margins as of 2025, an improving product mix, utilisation uptick and price hikes on the back of tightening industry S&D in the coming years should drive OPM upside for the segment, in our view.
Valuation
Our Dec-27 PT of NT$200 is based on a one-year forward P/B of 4x to reflect new record high ROE of close to 30% by 2028 (previous: 2.5x, 15-20% ROE). This is due to the structural improvement in electronic material margins caused by NPC's transition towards AI-grade electronic materials. We see NPC's ROE improving to >25% over the next two years. For comparison, NPC's historical 10-year average P/B and ROE are 1.6x and 9%, respectively.
Performance Drivers
rigure 1. Nre quartelly cammings (Miglin)
Unit: NID in millions
1025
2025
Revenue
Plastics (PVC products) |
Electronic materials
J.P. Morgan
65,552
9,030
28,033
Polyester
11,787
Chemicals (MEG, BPA, etc.) |
Others
Operating Income
Polyester|
Others
OPM|
Plastics (PVC products)
Electronic materials
Polyester
Chemicals (MEG, BPA)
Others
Equity Income (23% FPCC, 29.5% NYT)
Other non-OP
Total Non-op Income
Pre-tax Income
Tax Expense
Minority Interest
Net Income
EPS
ROE%
DPS
Payout%
Consensus
Sales
OPI
NP
EPS
2020
273,354
40.921|
119.777
43,580
64.902
4.174
2,215
1,520
7.8%
8.7%
10.2%
3.8%
3.4%
36.4%
6,643
2,575
9,218
2021
411,670
48.624
182.319
58,320
117.234
5.173
32,709
(1,042)|
19.7%
6.7%
21.9%
10.4%
27.9%
-20.2%|
20,748
1,731
22,480
4026e
84,812
8.192
52,685
10,718
12.116
1,100|
11,638
464
9,463
1,136
136
438
13.7%
5.7%
18.0%
10.6%
1.1%
39.9%
18,531
(179)
18,353
2022
355,183
43.419|
160.662
63,957
82.491
4.654
2,399
(4.828)
9.0%
4.9%
17.6%
6.4%
2.9%
-103.7%|
4,819
10,688
15,507
3026e
75,685
8,192
43,558
10,718
12.116
1.100
7,631
768
7.187
(235)
(242)
153
10.1%
9.4%
16.5%
2.2%
-2.0%
13.9%
13,862
(179)
13,683
2023
259,755
38.539
115.546|
45.211|
54.900
5,560
(6,287)
751
0.8%
6.5%
4.8%
-1.3%
-11.5%|
13.5%
3,974
3.194
7,168
2026e
75,407
9.214
43,000
10,819
11.274
1.100|
6,543
864
6.665
(237)
902)
153
8.7%
9.4%
15.5%
-2.2%
-8.0%
13.9%
14.415|
(179)
14,236
2024
259,608
39.2381
108,365
48,510
58,363
5.134
(3,549)
1,390
0.2%
7.9%
0.0%
•1.0%
-6.1%
27.1%
1,414
2,675
4,089
1026
68,600
9,122
36,222.
10,712
11.162
1,381
3,780
4,759"
855
(235)
(1,792)"
192
5.5%
9.4%
13.1%
-2.2%
-16.0%|
13.9%
12,120
180
12,300
2025
259,912
36.251
120,618
41,698
56.665
4.680
(5,403)
1,551
1.4%
8.2%
4.4%
-1.7%
-9.5%
33.1%
3,590
(834)
2,755
2026E|
304,503
34.721|
175,465
42,968
46,669
4.680
29,591
2,951
28.074\
430|
(2,800)
936
9.7%
8.5%
16.0%
1.0%
-6.0%
20.0%|
58.928
(357)
58,572
2027E|
376,983
34.902
247.227
42,968
47,207
4.680
57,883
3.071
54,390
430
(944)|
936
15.4%
8.8%
22%
1.0%
-2.0%
20.0%
79,021
62
79,084
3025
64,177
8,982
29.911'
9,405
14.728
1,152
1.6%
8.4%
3.8%'
-3.9%
-7.3% |
51.6%
2,208
2,964
4025
64,467
9,005
32,797
9,918
11,544
1,202
2.1%
8.9%
7.6%
-3.1%
-17.5%
31.4%
3.919
591
4,510
15.631
1,071
0.1%
7.7%
1.7%
-1.3%
-9.5%
45.1%
436
342
778
application on M9 CCL have been emerging on the back of advancement in resin technology. This marks an expansion in TAM as M9 was originally qualified for Q-glass only (Figure 3 C o m a p i r s n f d t c l e h - b g u ). We view this as positive for NPC's M9 CCL market entry, as the company's partnership with Nittobo (JPM note) also includes long-term supply agreement of NER-yarn, which is earmarked for exclusive use for NPC's in-house CCL production. We believe NPC has submitted M9/M10 samples with both NER and Q glass options, and is currently awaiting customer qualification with potential end-2026 production and earnings contribution in 2027. NPC's breakthrough in M7+ CCL markets could represent a significant margin driver. Compared to NPC's previous M6 or lower products, we estimate an upgrade to M7-8 might lift prices by 30-80%, while an upgrade to M9 might lift prices by over 5x. 814 4,000 5,839 16,080 20,779 21,314 29,990 30,438 103,464 47,551 9.130 4,523 6,459 88,163 136,966
65,716
9,235
29,877
10,588
14.763
1,255
2.0%
7.9%
4.0%
1.0%
-5.6%
7.7%
(2,972)
(2,524)'
(5,496)
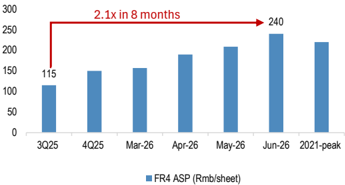
- Further upside to the 10%-40% industry price hikes: Following the 10%-40% price hike announcement across the industry in early Apr, major CCL producers (EMC, ITEQ, TUC) have all been printing record high single month sales (JPM notes on Apr/May revenue release), while NPC sees revenue reaching a 45+ month high. Price hikes have been swiftly converting to earnings, with EMC's May attributable NP reaching NT $3.25bn, +199% y/y and already representing 40% of 2Q consensus. Post Kingboard's price hike announcement, NPC commented that 'pricing deliberation with clients will continue' to ensure 'full reflection of ongoing market S-D condition'. Management had previously guided in our fireside chat that 2Q margin improvement remains on track as the full quarter contribution of the CCL price hike (16 Mar) feeds through, and we expect the 2Q electronic materials margin to exceed 15% (+11pct y/y), marking a three-year high.
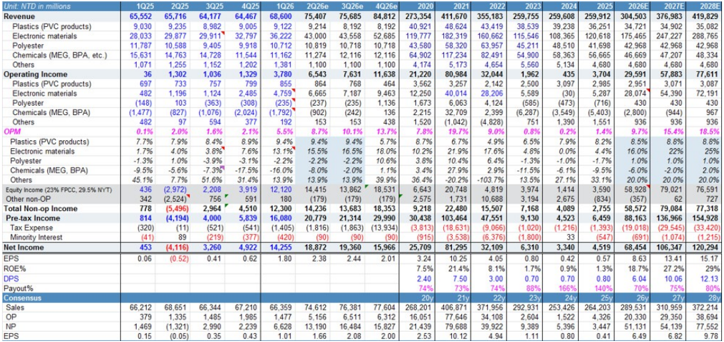
- Raise EPS by 38%-65% and PT to a new Street-high of NT$200 : We raise FY26-28E EPS to reflect an improved electronic materials product mix, as well as upward revisions to consensus expectations for NYT (equity method income) and NY PCB. Our FY26-28 EPS is 34-97% above the Street. We now forecast NE/NER/T glass to account for 50% of glass fiber revenue by 2028 (previous: 20%), while M7+ will account for >60% of CCL revenue by 2028 (previous: 30%). The improved product mix results in electronic materials OPM reaching a new record high of 28% in 2Q28, versus the previous peak of 23% in 2Q21. Our PT is based on 4x P/B (previous: 2.5x) to reflect ROE rising to 29% by 2028 (previous: 20%). Our revised PT of NT$200 implies 15x 2027 P/E, versus industry peers at 27-78x 2027E P/E and 11x P/B, ROE 28% (Figure 4).
Figure 1: NPC quarterly earnings (NT$mn)
Source: Company data, JP Morgan estimates
756
rigure 4. Nre electrome Matellal UrI 70
rigule 4. Al Matellais compo
30%
18,000
Ticker JPM rating YTD share
25%
16,000
J.P. Morgan
PCB avg
Glass Fiber avg
20%
price perf
80%
253%
14,000
Copper fol avg
CCL avg
15%
12,000
10,000
10%
8,000
MLCC upstream avg
MLCC avg
5%
6,000
Memory avg
Nanya Plastic (NPC) 1303 TT
0%
-5%
4,000
FCFC
1326 TT
FPC
2,000
-10%
FPCC
1301 TT
6505 TT
Q17
4017
Nov-20
Figure o. Nre electrome matellar Ur opil (nioon)
rigure o. Nre electrome Matellal Ur sont NIeul
80
60
40
20
0
Div yld (%)
EPS yly growth (%)
2026E
ROE (%)
26E
2027E
0.7
0.6
0,4
1.61
4.31
0.01
0.11
0.0
2019
POB
2026E
12.3
30.7
8.5
2.9
0.9
1.3
2028E
6.4
15.4
2.9
7.0
8.5
6.1l
2.0
2.6
0.9
1.2
P/BV (x)
2027E
9.2
22.5
6.8
2.7
0.9
1.2
OW
OW
OW
OW
2Q19
Sep-21
156%
131%
69%
33%
12%
Jul-22
Od -23
Dec-22
Aug-24
20L
4Q26e
Jun-25
May-23
Mar-24
Jan-25
Feb-22
3Q27e
Nov-25
PE (x)
2027E
Apr-26
Apr-21
Figure 2: NPC electronic material OPM %
Source: Company data, J.P. Morgan estimates
Figure 4: AI Materials comps
Source: Bloomberg Finance LP, J.P. Morgan Asia Energy Research. Priced on 20 June 2026. Note: PCB, Glass Fiber, Copper foil, CCL and Memory basket show the simple average valuation multiples of Asia-listed peers - detailed comps sheet available on request.
Figure 5: China FR4 CCL ASP (Rmb/sheet)
Source: Company data, J.P. Morgan Asia Energy Research
Figure 6: China G75 electronic glass fiber yarn price
Rmb/t
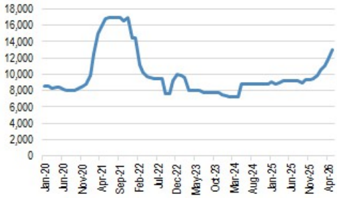
Source: Company data, Wind, J.P. Morgan Asia Energy Research
8
0.9
0.9
0.9
2028E
2027E
73328
2020 2021 2022 2023 2024 2025 2026e 2027e 2028e
1÷28
Copper fol
• Epoxy
-Ciner
• Glass dom
- Total
Figure 3: NPC electronic material OP split (NT$bn)
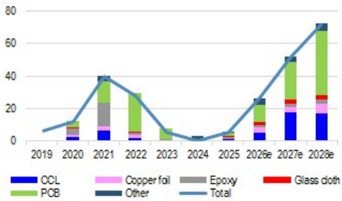
Source: Company data, J.P. Morgan estimates
2027E
3Q15
2Q16
Jan-20
3Q18
1Q20
rigure 10. oir. Morganl cammings levision lor Nall la rlastico bn NTS
15.0
J.P. Morgan
26E
Current
27E
14.0
Formosa Group
NPC
13.0
Revenue
OP
NP
DPS
PT (NTS/sh)
Rating
ROE%
14.2 14.2 14.6
304.5
377.0
19%
DPS as % curr px
4%
Jan Feb Mar
27%
7%
9%
Apr
May Jun
Jul Aug Sep Oct Nov
28E
372.2
52.4
77.6
7.3
Dec
Consensus
26E
Glass yam
28E
Change
27E
11%
13%
27E 28E
2%
289.5
372.2
Glass cloth
Figure 7: Electronic material price hike announcements since 2025
311.0
Epoxy
19%
| Date | Company | Announced Pricing adjustment |
|---|---|---|
| CCL | ||
| Jan 16th, 2026 | Resonac | All CCL +30% for shipments from 1 Mar, 2026 onwards. Prev hike was 10% in Nov 2022 and 15% in Jan 2022 |
| Mar 10th, 2026 | Kingboard | +10% price hike across CCL/PP/copper foil processing fee |
| Mar 16th, 2026 | NPC | +15% across CCL products |
| Apr 3rd, 2026 | Kingboard | +10% price hike across CCL/PP products citing raw material price inflation |
| Apr, 2026 | EMC | High-end CCL +10% from 2Q26 |
| Apr, 2026 | TUC | +20%-40% for selected CCL products |
| Apr 9th, 2026 | Panasonic | CCL/prepeg/FRP/FPC materials price +15-30% from May 2026 |
| Apr, 2026 | ITEQ | High-end CCL +10% |
| Apr 28th, 2026 | Kingboard | +10% price hike on FR4/PP products |
| May 27th, 2026 | Kingboard | +10%/20% price hike on CCL/PP products |
| Jun, 2026 | Kingboard | +15% price hike on FR4/PP products |
| Electronic-grade Glass Fiber | ||
| Aug 1st, 2025 | Nitto Boseki | 20% price hike on various glass fiber products |
| Apr-26 | Nitto Boseki | 30% price hike on T-glass, implemented April through July |
| Copper Foil | ||
| Aug, 2025 | Co-Tech | 5-10% hike in processing fee for standard copper foil/HVLP4 |
| Sep 29th, 2025 | China Electronic Material Industry Association | 'Recommendation' for an industry - wide increase in processing fees for electronic copper foil: +Rmb2/kg |
| Sep, 2025 | NPC | Single-double digit% across conventional/high-end copper foil product |
| Oct, 2025 | Mitsui Metal | +US$2/kg (~15% increase) in high-end copper foil price |
Source: Company data, J.P. Morgan Asia Energy Research. Above list not exhaustive.
Figure 8: NPC monthly electronic material revenue
NT$ bn
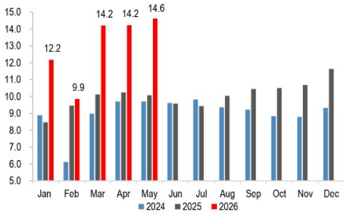
Figure 9: NPC 2025 electronic materials revenue breakdown
Source: Company data. Based on the company's preliminary disclosures; numbers may be restated in the audited quarterly financial statements.
Source: Company data, J.P. Morgan
Figure 10: J.P. Morgan earnings revision for Nan Ya Plastics
Source: J.P. Morgan estimates, Bloomberg Finance L.P. Priced on 20 June 2026.
12.2
Previous
27E
339.3
39.9
64.5
6.1
28E
419.8
26E
306.0
26E
0%
11%
38%
38%
JPM v Cons
26E
28E
27E
CCL
26%
5%
46%
34%
21%
97%
96%
87%
136%
Copper
Foll
13%
13%
101%
55%
66%
J.P. Morgan
Total OP
Plastics/PVC
PCB
CCL
Epoxy
Copper foil
Glass Cloth
Other
Polyester
Previous
2026
2027
26,618
2,951
5,503
1,256
973
1,135
6,040
Revised
2027
57,883
3,071
1,895
3,938
2,448
5,671
2028
77,611
3,087
72,191
39,251
16,927
2,804
6,070
2,445
4,694
430
Non-OP
430
2026
29,591
2,951
1,256
2,812
2,037
6,025
430
430
Figure 11: NPC detailed earnings changes (NT$mn)
of which NYT
Other non-OP
Pretax
NP
39,913
3,071
10,083
1,353
2,379
1,313
3,844
430
(186)
2028
52,449
3,087
9,244
1,402
4,150
873
8,316
430
2,033
47,433
2026
2,973
(52)
1,839
902
(14)
(451)
21,344
Change
2027
17,970
17,792
5,472
7,258
541
1,559
1,135
1,827
(758)
35,946
2028
25,162
25,292
16,338
7,683
1,402
1,920
1,571
(3,622)
(1,066)
29,885
| 49,627 | 65,001 29,178 | 65,001 29,178 | 65,001 29,178 | 36,348 20,449 | 36,348 20,449 | 36,348 20,449 | 28,653 | 28,653 | 28,653 |
|---|---|---|---|---|---|---|---|---|---|
| 8,945 | 71,085 7,999 | 12,316 | 8,050 | 35,939 | 11,085 | 894 | 35,146 800 | 1,232 | |
| 88,163 | 136,966 | 154,928 | 63,846 | 7,199 83,051 | 99,882 | 24,317 | 53,915 | 55,046 | |
| 106,347 | 120,294 | 49,573 | 64,484 | 77,553 | 18,881 | ||||
| 68,454 | 41,863 | 42,741 | |||||||
| nan |
Source: J.P. Morgan estimates, Bloomberg Finance L.P. Note: NYT and NYPCB earnings based on BBG consensus.
Figure 12: 1week share price performance of PCB/CCL value chain names % share price move
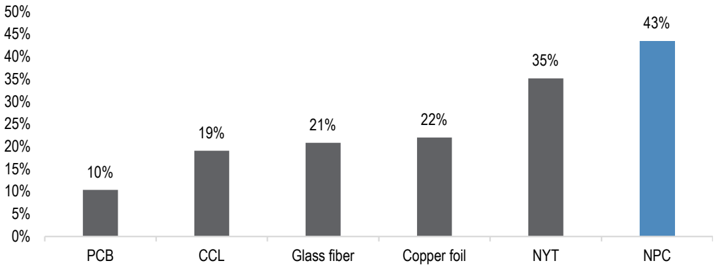
Source: Bloomberg Finance L.P., J.P. Morgan Asia Energy Research
Related Research
Nan Ya Plastics Corp: >20% electronic materials revenue growth in 2Q26? Accumulate on dips (8 Jun 2026)
Nan Ya Plastics Corp: April revenue reached another 40+ month high. 2Q OPM expansion on track as price hike feeds through. Remain OW (7 May 2026)
Nan Ya Plastics Corp: 10-40% CCL price hikes across the industry into 2Q; positive management call takeaways (20 Apr 2026)
Taiwan Energy: Blockbuster 1Q beat; raising PTs; stay OW on the full house; prefer NPC > FPC/FCFC >FPCC (12 Apr 2026)
Asia Chemicals: China's Anti-Involution, Part 3: More policy measures crystallize, we upgrade Formosa Group to full house OW; 2026 the start of a 3-year earnings upcycle?(24 Feb 2026)
Taiwan Energy: Strong electronic materials beat; remain OW on NPC for AI-driven electronic materials price hikes and margin expansion in 2026 (12 Jan 2026)
Nan Ya Plastics Corp: Share price +10% on another NYT record-high monthly revenue print; Next catalysts: M8 CCL and T-Glass entry in 2026? (8 Jan 2026)
Nan Ya Plastics Corp: Solid Nov revenue growth momentum illustrates fundamental electronic material S-D tightness (8 Dec 2025)
Electronic Materials Sector: First Take: Nan Ya Plastics and Nittobo announce specialty glass collaboration (30 Nov 2025)
Taiwan Energy: Turning more positive post a four-year de-rating; upgrade NPC to OW on improved electronic materials earnings outlook; remain OW FPCC (21 Sep 2025)
Investment Thesis, Valuation and Risks
Nan Ya Plastics Corp (Overweight; Price Target: NT$200.00)
Investment Thesis
NPC is a major producer of electronic materials (CCL, Copper foil, Epoxy Resin, glass fiber, PCB), polyester, chemicals (mainly MEG/BPA), and PVC plastics. We are OW on NPC on the back of emerging EPS positives from a multi-year PCB material supply tightness and its transition towards specialty grade electronic materials. While we estimate that >90% of NPC's electronic materials sales are commodity-grade with lower margins as of 2025, an improving product mix, utilisation uptick and price hikes on the back of tightening industry S&D in the coming years should drive OPM upside for the segment, in our view.
Valuation
Our Dec-27 PT of NT$200 is based on a one-year forward P/B of 4x to reflect new record high ROE of close to 30% by 2028 (previous: 2.5x, 15-20% ROE). This is due to the structural improvement in electronic material margins caused by NPC's transition towards AI-grade electronic materials. We see NPC's ROE improving to >25% over the next two years. For comparison, NPC's historical 10-year average P/B and ROE are 1.6x and 9%, respectively.
Risks to Rating and Price Target
Downside risks include weaker-than-expected MEG/BPA demand due to a weak macro or tariffs, a deceleration in global AI/datacenter capex, unsuccessful PCB/substrate price hikes/ next-gen electronic material qualification, and a loss of electronic materials market share.
Nan Ya Plastics Corp: Summary of Financials
| Income Statement | FY24A | FY25A | FY26E | FY27E | FY28E | Cash Flow Statement | FY24A | FY25A | FY26E | FY27E | FY28E |
|---|---|---|---|---|---|---|---|---|---|---|---|
| Revenue | 259,608 | 259,912 | 304,503 | 376,983 | 419,829 | Cash flow from operating activities | 18,786 | 8,649 | 72,768 | 108,667 | 132,034 |
| COGS | (241,034)(238,313)(255,577)(295,899)(316,707) | o/w Depreciation & amortization | 22,032 | 21,933 | 22,345 | 22,774 | 23,117 | ||||
| Gross profit | 18,574 | 21,599 | 48,926 | 81,084 | 103,123 | o/w Changes in working capital | (4,244) | (6,222) | (15,694) | (20,802) | (12,835) |
| SG&A | (18,228) | (17,896) | (19,359) | (23,237) | (25,560) | ||||||
| Adj. EBITDA | 23,136 | 26,221 | 52,255 | 81,056 | 101,240 | Cash flow from investing activities | (17,900) | (11,332) | (11,329) | (11,766) | (9,413) |
| D&A | (22,702) | (22,518) | (22,664) | (23,173) | (23,629) | o/w Capital expenditure | (12,640) | (11,329) | (11,329) | (11,766) | (9,413) |
| Adj. EBIT | 435 | 3,704 | 29,591 | 57,883 | 77,611 | as % of sales | 4.9% | 4.4% | 3.7% | 3.1% | 2.2% |
| Net Interest | (2,063) | (2,456) | (2,631) | (2,479) | (2,036) | ||||||
| Adj. PBT | 4,523 | 6,459 | 88,163 | 136,966 | 154,928 | Cash flow from financing activities | (20,112) | (16,751) | (68,499) | (88,187)(104,262) | |
| Tax | (1,216) | (1,393) | (19,018) | (29,545) | (33,420) | o/w Dividends paid | (5,615) | (5,562) | (47,918) | (79,760) | (96,235) |
| Minority Interest | 33 | (547) | (691) | (1,074) | (1,215) | o/w Shares issued/(repurchased) | 0 | 0 | 0 | 0 | 0 |
| Adj. Net Income | 3,340 | 4,519 | 68,454 | 106,347 | 120,294 | o/w Net debt issued/(repaid) | (9,950) | (7,554) | (20,582) | (8,426) | (8,028) |
| Reported EPS | 0.42 | 0.57 | 8.63 | 13.41 | 15.17 | Net change in cash | (13,856) | (20,295) | (7,061) | 8,714 | 18,359 |
| Adj. EPS | 0.42 | 0.57 | 8.63 | 13.41 | 15.17 | ||||||
| DPS | 0.70 | 0.80 | 6.04 | 10.06 | 12.13 | Adj. Free cash flow to firm y/y Growth | 7,653 (40.4%) | (754) (109.8%)(8526.6%) | 63,502 | 98,845 55.7% | 124,217 25.7% |
| Payout ratio | 166.2% | 140.4% | 70.0% | 75.0% | 80.0% | ||||||
| Shares outstanding | 7,931 | 7,931 | 7,931 | 7,931 | 7,931 | ||||||
| Balance Sheet | FY24A | FY25A | FY26E | FY27E | FY28E | Ratio Analysis | FY24A | FY25A | FY26E | FY27E | FY28E |
| Cash and cash equivalents | 66,445 | 46,150 | 39,089 | 47,803 | 66,162 | Gross margin | 7.2% | 8.3% | 16.1% | 21.5% | 24.6% |
| Accounts receivable | 41,852 | 46,344 | 51,663 | 63,961 | 71,230 | EBITDA margin | 8.9% | 10.1% | 17.2% | 21.5% | 24.1% |
| Inventories | 51,696 | 51,303 | 65,804 | 81,467 | 90,726 | EBIT margin | 0.2% | 1.4% | 9.7% | 15.4% | 18.5% |
| Other current assets | 25,508 | 34,039 | 36,938 | 37,664 | 37,421 | Net profit margin | 1.3% | 1.7% | 22.5% | 28.2% | 28.7% |
| Current assets | 185,502 | 177,836 | 193,494 | 230,894 | 265,538 | ||||||
| PP&E | 219,151 | 208,547 | 197,531 | 186,524 | 172,820 | ROE | 0.9% | 1.3% | 18.7% | 27.2% | 28.9% |
| LT investments | 170,623 | 184,104 | 184,104 | 184,104 | 184,104 | ROA | 0.5% | 0.7% | 11.2% | 16.9% | 18.4% |
| Other non current assets | 42,198 | 40,111 | 41,089 | 41,089 | 41,089 | ROCE | 0.1% | 0.6% | 4.5% | 8.7% | 11.3% |
| Total assets | 617,473 | 610,598 | 616,219 | 642,612 | 663,552 | SG&A/Sales | 7.0% | 6.9% | 6.4% | 6.2% | 6.1% |
| 93,325 | 76,946 | Net debt/Equity Net debt/EBITDA | 0.3 4.2 | 0.3 4.8 | 0.2 1.8 | 0.2 1.0 | 0.1 0.5 | ||||
| Short term borrowings Payables | 97,303 43,368 | 41,245 | 45,371 | 71,297 52,530 | 70,397 56,223 | ||||||
| Other short term liabilities | 0 | 130 | 0 | 0 | 0 | Sales/Assets (x) | 0.4 | 0.4 | 0.5 | 0.6 | 0.6 |
| Current liabilities | 140,671 | 134,700 | 122,318 | 123,827 | 126,621 | Assets/Equity (x) | 1.8 | 1.7 | 1.7 | 1.6 | 1.6 |
| Long-term debt | 83,336 | 79,759 | 75,556 | 72,779 | 65,651 | Interest cover (x) | 11.2 | 10.7 | 19.9 | 32.7 | 49.7 |
| Other long term liabilities | 30,864 | 24,341 | 24,341 | 24,341 | 24,341 | Operating leverage | 137700.7%644032.2% | 4074.2% | 401.7% | 299.9% | |
| Total liabilities | 254,870 | 238,800 | 222,214 | 220,946 | 216,613 | Tax rate | 26.9% | 21.6% | 21.6% 17.2% | 21.6% | 21.6% 11.4% |
| Shareholders' equity | 346,583 | 355,666 | 377,180 | 403,767 | 427,825 | Revenue y/y Growth | (0.1%) (8.9%) | 0.1% 13.3% | 23.8% | 24.9% | |
| EBITDA y/y Growth | 99.3% | 55.1% | |||||||||
| Minority interests | 16,020 | 16,133 | 16,825 | 17,899 | 19,114 | ||||||
| Total liabilities & equity | 617,473 | 610,598 | 616,219 | 642,612 | 663,552 | EPS y/y Growth | (47.1%) FY24A | 35.3% FY25A | 1414.9% FY26E | 55.4% FY27E | 13.1% FY28E |
| BVPS | 43.70 | 44.85 | 47.56 | 50.91 | 53.94 | Valuation | |||||
| y/y Growth | (3.8%) | 2.6% | 6.0% | 7.0% | 6.0% | P/E (x) P/BV (x) | 330.0 3.2 | 244.0 3.1 | 16.1 2.9 | 10.4 2.7 | 9.2 2.6 |
| Net debt/(cash) | 97,939 | 126,934 | 95,439 | 78,299 | 51,913 | EV/EBITDA (x) | 52.6 | 47.5 | 23.2 | 14.8 | 11.6 |
| Dividend Yield | 0.5% | 0.6% | 4.3% | 7.2% | 8.7% |
Source: Company reports and J.P. Morgan estimates.
Note: NT$ in millions (except per-share data).Fiscal year ends Dec. o/w - out of which
request.
Nan Ya Plastics Corp (1303. TW, 1303 TT) Price Chart
J.P. Morgan
200
125
Price(NT$) 100
OW NT$50
OW NT$120
Da
28
10
13
21.
20
14
25
12
Companies Discussed in This Report (all prices in this report as of market close on 18 June 2026, unless otherwise indicated) Formosa Chemicals and Fibre Corp(1326.TW/NT$54.20/OW), Formosa Petrochemical Corp(6505.TW/NT$53.50/OW), Formosa Plastics Corp(1301.TW/NT$51.70/OW)
25
Analyst Certification: The Research Analyst(s) denoted by an 'AC' on the cover of this report certifies (or, where multiple Research Analysts are primarily responsible for this report, the Research Analyst denoted by an 'AC' on the cover or within the document individually certifies, with respect to each security or issuer that the Research Analyst covers in this research) that: (1) all of the views expressed in this report accurately reflect the Research Analyst's personal views about any and all of the subject securities or issuers; and (2) no part of any of the Research Analyst's compensation was, is, or will be directly or indirectly related to the specific recommendations or views expressed by the Research Analyst(s) in this report. For all Korea-based Research Analysts listed on the front cover, if applicable, they also certify, as per KOFIA requirements, that the Research Analyst's analysis was made in good faith and that the views reflect the Research Analyst's own opinion, without undue influence or intervention.
All authors named within this report are Research Analysts who produce independent research unless otherwise specified. In Europe, Sector Specialists (Sales and Trading) may be shown on this report as contacts but are not authors of the report or part of the Research Department.
圖片清單(已驗證 2026-07-02)
回補驗證:僅涵蓋已被 lib 頁嵌入的圖片,非全量驗證。
| 檔名 | size | 分類 | 親眼所見內容 |
|---|---|---|---|
20260621_1303_南亞_JPM_Nan Ya Plastics Corp_004.png |
13KB | 真資料圖 | 長條圖,FR4 ASP (Rmb/sheet),3Q25至2021-peak,標註紅字「2.1x in 8 months」 |
20260621_1303_南亞_JPM_Nan Ya Plastics Corp_006.png |
58KB | 真資料圖 | 疊加長條圖+Total折線,CCL/Copper foil/Epoxy/PCB/Glass cloth/Other 各分項,2019-2028e |